Back

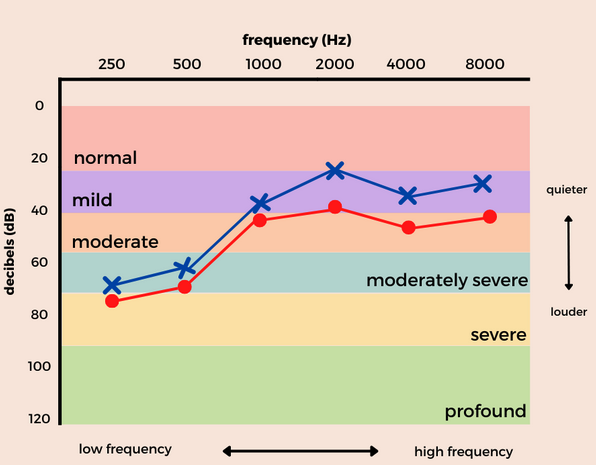
How to Read a Hearing Test

A chart showing regions of a hearing test that indicate normal, mild, moderate, moderately severe, severe or profound hearing loss. The x-axis shows frequency in hertz, and the y-axis shows decibels.